
The Yellow Taxicab: an NYC Icon
Harvard Data Science Final Project Video
New York City, being the most populous city in the United States, has a vast and complex transportation system, including one of the largest subway systems in the world and a large fleet of more than 13,000 yellow and green taxis, that have become iconic subjects in photographs and movies.
The subway system digests the lion share of NYC's public transport use, but the 54% of NYC's residents that don't own a car and therefore rely on public transportation still take almost 200 million taxi trips per year!
Predicting pickup density using 440 million taxi trips
Thanks to some FOIL requests, data about these taxi trips has been available to the public since last year, making it a data scientist's dream. We endeavoured to delve into this gold mine using 2.5 years of NYC taxi trip data - around 440 million records - going from January 2013 to June 2015.
The primary objective of this project was to predict the density of taxi pickups throughout New York City as it changes from day to day and hour to hour. So, given a specific location, date and time, can we predict the number of pickups in that location to a reasonably high accuracy? A secondary objective was to also predict the dropoff location.
Making transportation more efficient
Predictive models like these are interesting for many people, including of course the taxi companies themselves.
- Taxi companies: Companies can maximize their utilization by diverting the cabs into the locations during specific times
- Traffic planning: Planners can use the model predictions for traffic management on specific day/time/locations. The model can be enhanced in future to incorporate features like weather, holiday etc.
- Data scientists: It is interesting for data scientists to see how we have modeled location data in a simple way and yet able to get reasonably good predictions
Random forests find the hot spots
After preparing the data in the cloud with Amazon Web Services, we trained random forests with deep trees to predict the pickup density. We did that in two approaches, one which predicts pickup density on an average day of the week (e.g. Mondays). A second forest predicts pickup density on a specific day (e.g. May 1, 2015). The first performs really well, being able to account for 95% of the variation in the data. The second, which also incorporates weather data, still does reasonable well, predicting density within about a factor of 1.5.
Lastly, we started work on predicting where people wanted to be dropped off, based on their pickup location. Initial results aren't terribly good, but we have ideas to improve upon this.
Our Approach
1. The data we used:
2. Exploratory data analysis
- The data is currently available in Google BigQuery, which allowed us to explore the data directly in Tableau.
Number of Pickups in 2013 and 2014
Throughout the days of the year (horizontal axis) and the hours of the day (vertical axis)

3. Data preparation with Apache Spark
Amazon Web Services (AWS) Cluster: (notebook)
- We used AWS to setup a 5-node Spark cluster (each machine had 8 cores, 16 GB RAM), and configured the cluster setup to leverage maximum resources by Spark.
- We especially used the cluster to load the 60+ GB of raw data into an Amazon S3 bucket, and to process and prepare the data for input into machine learning algorithms (see the next step).
Data cleansing: (notebook)
- We had to parse 440 million records and remove dirty records (e.g. nulls, invalid geographical coordinates, etc.)
- Feature extraction:
- Location features: We used geohashing to discretize the location data. This is very important because we were able to adjust the granularity of the precision of the location (different size of rectangles) - and make predictions on these locations.
- We also added additional features based on the time and day of the week, seasons, et.
- We grouped the entire dataset by time (binned into half hours), day and geohashed location.
4. Machine learning (Pandas/Scikit learn)
Approach 1: Predicting the pickup density for an average day of week and time of day
- We used two models:
- The main features we used were
- Discretized latitude/longitude (derived back from geohashes)
- Discretized time - but encoded in 0 to 1
- Other features: number of pickups, day of week, etc
- The Random Forest model performed very well with a coefficient of determination (R-squared) on the test data of 0.9505, indicating that variation in the model explains over 95% of the variation in the pickup density distribution. We attribute this success to:
- How we modeled the data
- The ability of the Random Forest algorithm to capture the complexities in the above features, and especially latitude and longitude
- A taxi company could use this type of prediction for developing long-term policies for improved taxi distribution.
Predicted Density Distribution vs. Actual Density Distribution on a Monday
The above image shows the predicted number of pickups on a given Monday using a random forest regressor on the the left and the actual number of pickups on the right. The sheet number at the top of each image corresponds to the hour of the day.
Approach 2: Predicting the pickup density for a specific date and time in the future
- To make predictions about the future, we separated pre-2015 records from 2015 records, while keeping the data of each specific day of the year separate
- Combined NYC taxi trip data with features extracted from NYC weather data
- We trained a Random Forest regressor using pre-2015 data and tested regressor by on the 2015 data (notebook)
- A taxi company could use this type of prediction on a daily basis to tune their policies based on weather or other factors to maximize coverage on a specific day.
Underneath you find the importance of each of the features in the random forest. Clearly location is most important, followed by time of the day.
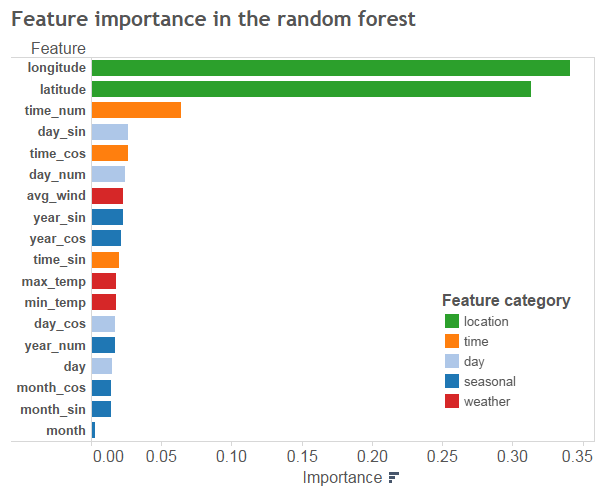 ]
]
Below you find the predicted and actual pick up density for May 1st, 2015.

Note: the noise in the data became more apparent when we used this fine temporal granularity, and the prediction accuracy decreased. We believe this results from the regressor thinking that that no data for a particular location and time means the number of pickups is unknown. Of course in reality, no records for a particular location and time means zero pickups at that location and time, because we assume that all taxi trips are recorded. We hypothesize that this shortcoming in our data preparation leads to the widespread overprediction in areas outside Manhattan.
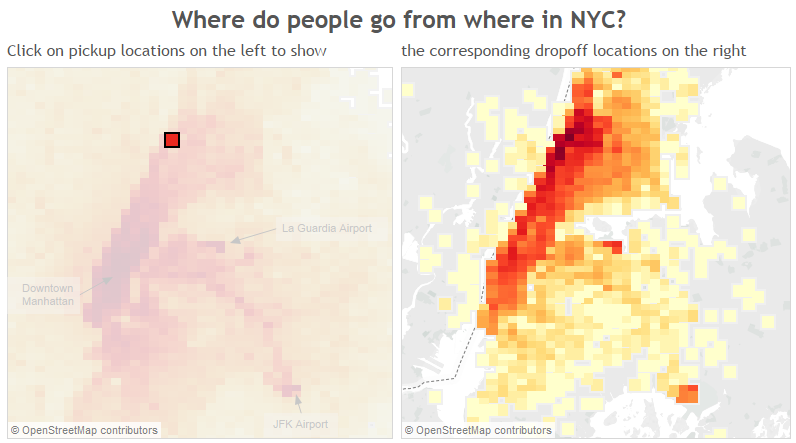
Approach 3: Predicting the dropoff location (lat/long) based on the pickup location & time, day of week
- Here we aggregated the dataset by pickup location, dropoff location, day of week & time slot: notebook
- We trained a random forest model on this for multi output regression: predicting two variables (dropoff lat/long): notebook. So the idea was that given that somebody hails a cab at location X, we would want to predict where that customer wants to be dropped of.
- The best RMSE value that we got was 0.120. In NYC each longitude is approx 53 miles & latitude is approx 69 miles (see notebook for reference). This gives an error range of 6 x 8 square miles. So we do not have a great predictor here (but a great learning experience in modeling this problem).
You can play around in Tableau by clicking on the image below to explore the dropoff locations, given a pickup location.
5. Next Steps:
To really make the pickup density model shine we would have to adjust the data preparation, so that we feed information about locations without any pickups to the model as well. Right now our model receives no data about the number of pickups in these locations is and thus thinks that the number of pickups is unknown. However, the absence of records at some locations means that there were zero rides in that time period. We believe that training a model with that knowledge would lead to more accurate predictions for the number of pickups on a specific date and time, such as May 1st at 6am.
The Project Team
Citations/Credit/References
- Thanks to Harvard AC209 TF's: Rahul Dave & Team: we used parts of their code in multiple places: (a) Cluster setup in AWS (b) Machine learning
- Geohash.py: A nice geohash library